
In today’s article, we will explore another approach to buying stocks. This strategy involves purchasing when the price returns to its normal range, speculating that it will rebound and continue to rise. It is one of several methods that can enrich our portfolio.
This time, we will use a simple indicator to identify the optimal moments for buying. Specifically, we will use the RSI oscillator. The RSI works by oscillating between values of 0 and 100. The logic is simple: when the value is low, it signals a buying opportunity.
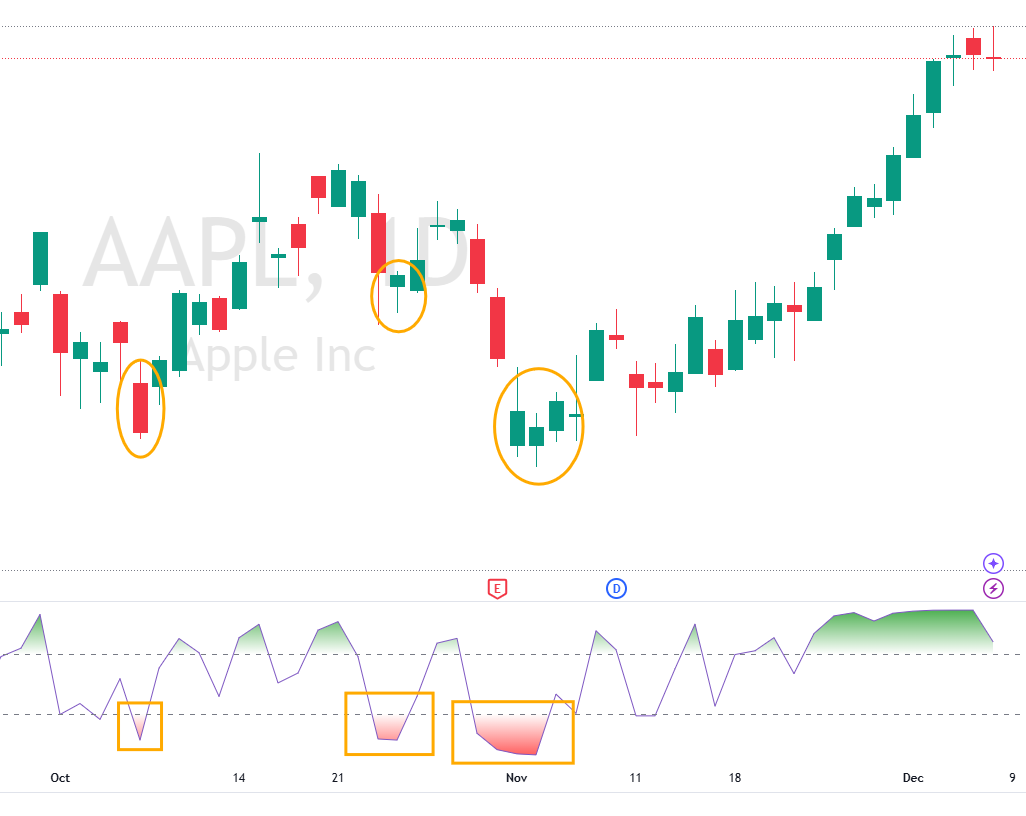
RS indicator with a value of 2 – orange boxes are buying areas
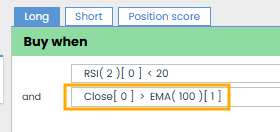
We will buy when the RSI indicator drops below the 20 level.
RSI(C, 2) < 20
Enrollment in AC:

Execution Timing
For today’s demonstration, we’ll buy at the end of the trading day, right as markets close. To achieve this, we’ll leave the entry trigger set to OnBarClose.

Stock Selection
Last time, we focused on breakout strategies with S&P 500 stocks. For a more diversified portfolio, we will now target stocks from the Russell 1000 index.
For demonstration purposes, we’ll maintain a maximum of 10 open positions and select stocks with the largest RSI drop. Since the AC position score selects stocks based on the highest value, we will need to modify the code slightly.

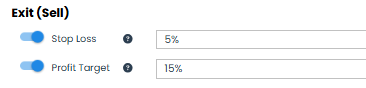
Variant 01 – StopLoss and ProfitTarget
In the first variant, we’ll use StopLoss and ProfitTarget to manage positions:
- StopLoss 5%
- ProfitTarget 15%
Wow 🙂 I think this is a great result for such a very simple condition.

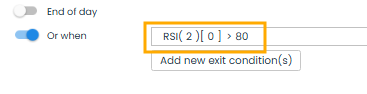
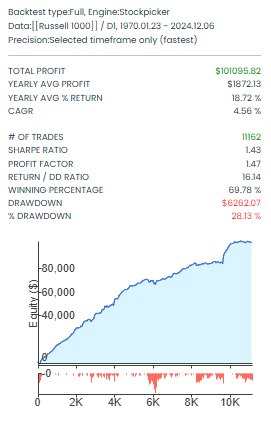
Variant 02 – Using RSI for Exit
In the second variant, we will again use the RSI indicator. If low RSI values signal entry points, we will use high RSI values for exits. Specifically, we will exit when the RSI value exceeds 80:
RSI(C, 2) > 80
Although the %DrawDown (DD) increased by 8%, the %Win doubled to 69,78% 👍. The increase in drawdown is manageable because the overall drawdown averages out across the portfolio. Plus, we haven’t added any trend filters yet.
What’s great is that we kept the strategy simple: we used the same indicator for both entry and exit, but with reversed logic.
Variant 03 – Adding a Trend Filter
In the final variant, we’ll add a simple trend filter to improve results by filtering out some poor trades. We will only enter trades when the closing price is above the 100-period exponential moving average:
O > EMA(C, 100)
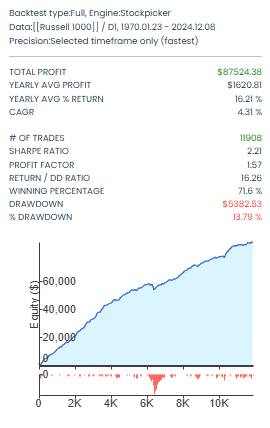
The difference is clear! The equity curve is much smoother, and we reduced the %DrawDown to 13,79% using a simple filter.
| Strategy type | Variant | # trades | Total Profit | CAGR | Profit Factor | Right/DD | Win % | DD % |
| BuyDip | Was 1 | 4376 | $86 662,00 | 4,29 | 1,55 | 16,75 | 32,05 | 20,,4 |
| BuyDip | Was 2 | 11162 | $101 095,00 | 4,56 | 1,47 | 16,14 | 69,78 | 28,13 |
| BuyDip | Was 3 | 11908 | $87 524,00 | 4,31 | 1,57 | 16,26 | 71,6 | 13,79 |
overall comparison of individual variants
Conclusion
In today’s article we have created 3 variants of a new strategy that buys dips in the trend. Of course, the results may look different because you can try different indicator periods, different entry and exit timings, different position score and maximum number of open positions, etc.
Just take a simple idea, write a condition and test. And especially to try new and new approaches.
In total, we have already created 10 different strategies in reserve, from which we will create the first portfolio next time, which we will deploy on the demo account.
You can clone and right away start testing all strategies mentioned in the article here:
- Variant 01 – StopLoss and ProfitTarget
- Variant 02 – Using RSI for Exit
- Variant 03 – Adding a Trend Filter
Libor Štěpán